Myths and Facts of Poverty
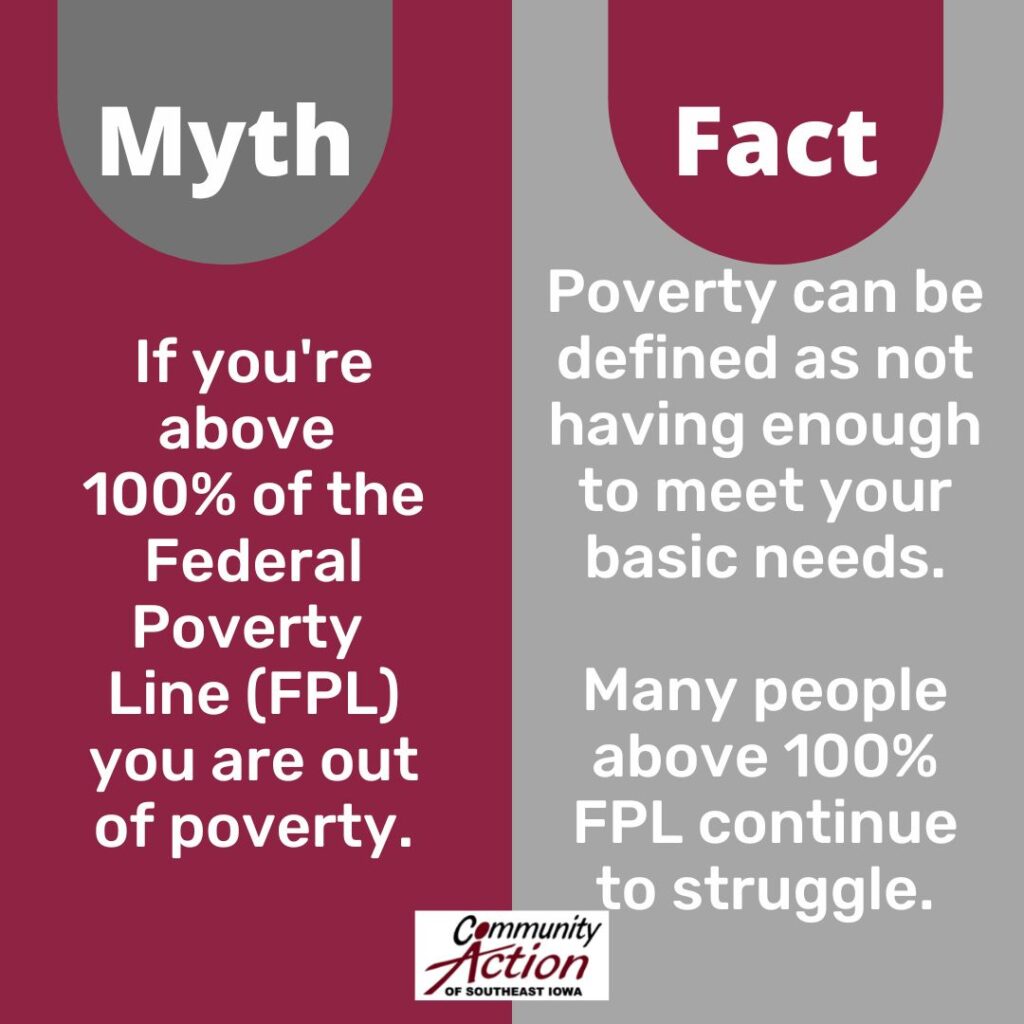
What is Poverty?
- A short explanation from Habitat for Humanity:
- View the poverty guidelines from the U.S. Department of Health and Human Services (HHS).
- You can also download the excel sheet of different percentages of the guidelines:
- https://aspe.hhs.gov/topics/poverty-economic-mobility/poverty-guidelines
- Explore the history of the US Poverty Measure with the US Census:
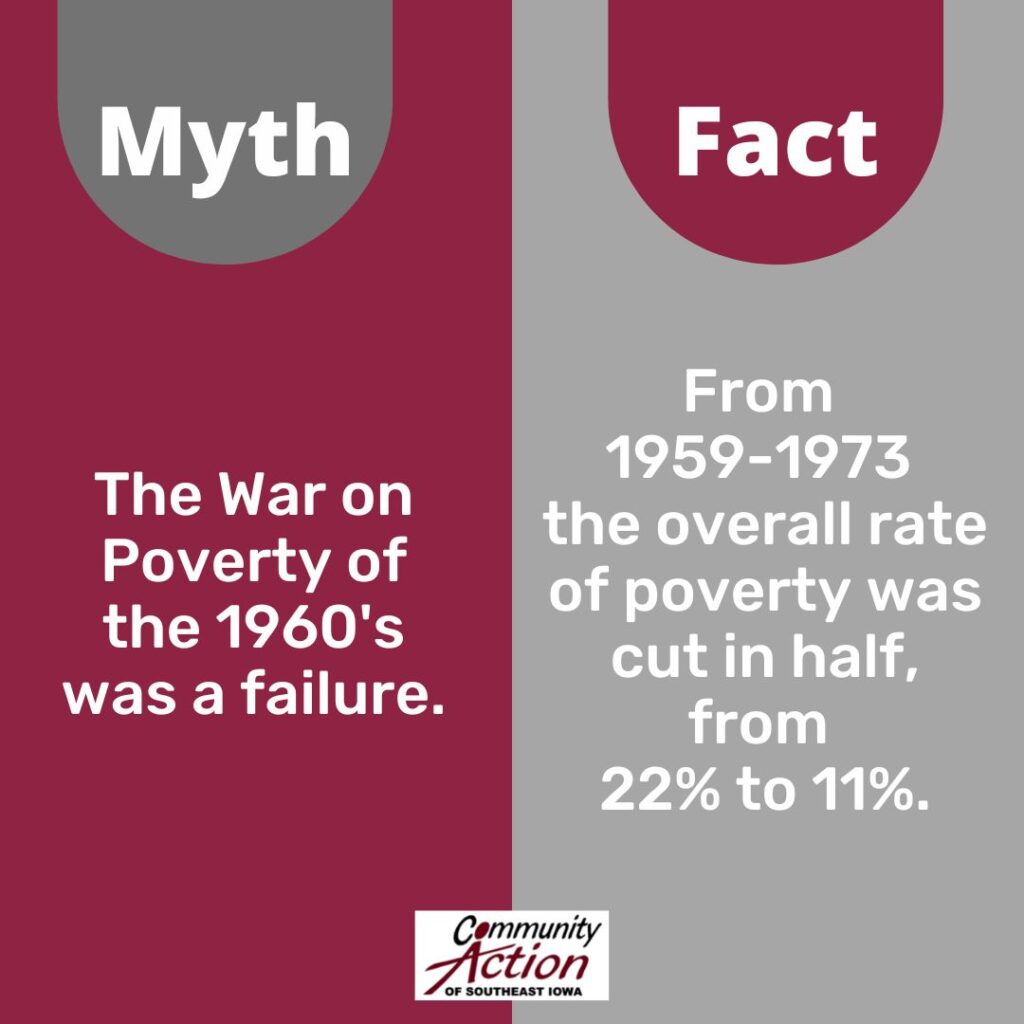
Was poverty eliminated during the War on Poverty? No.
Was it dramatically reduced? Absolutely.
From 1959 to 1973 the overall rate of poverty was cut in half, from 22.4 percent in 1959, to 11.1 percent in 1973. Likewise, poverty for children was dramatically reduced, from 27.3 percent to 14.4 percent. The 1960’s were a span of time where poverty in the United States was cut in half. This should be seen as a major economic accomplishment. The War on Poverty played an important role in this decline, along
with the robust economy of the period.
In 1959, the age group with the greatest risk of poverty was the elderly. By 2018 the age group with the lowest risk of poverty was the elderly. What happened? In four words— Social Security and Medicare. In 1959 the overall rate of poverty for those age 65 and over was 35.2 percent. By 2018, the rate of poverty for the elderly stood at 9.7 percent.
Read more under Myth #5 on Confronting Poverty:
https://markrank.wpengine.com/…/2020/07/CP_Facts_All.pdf
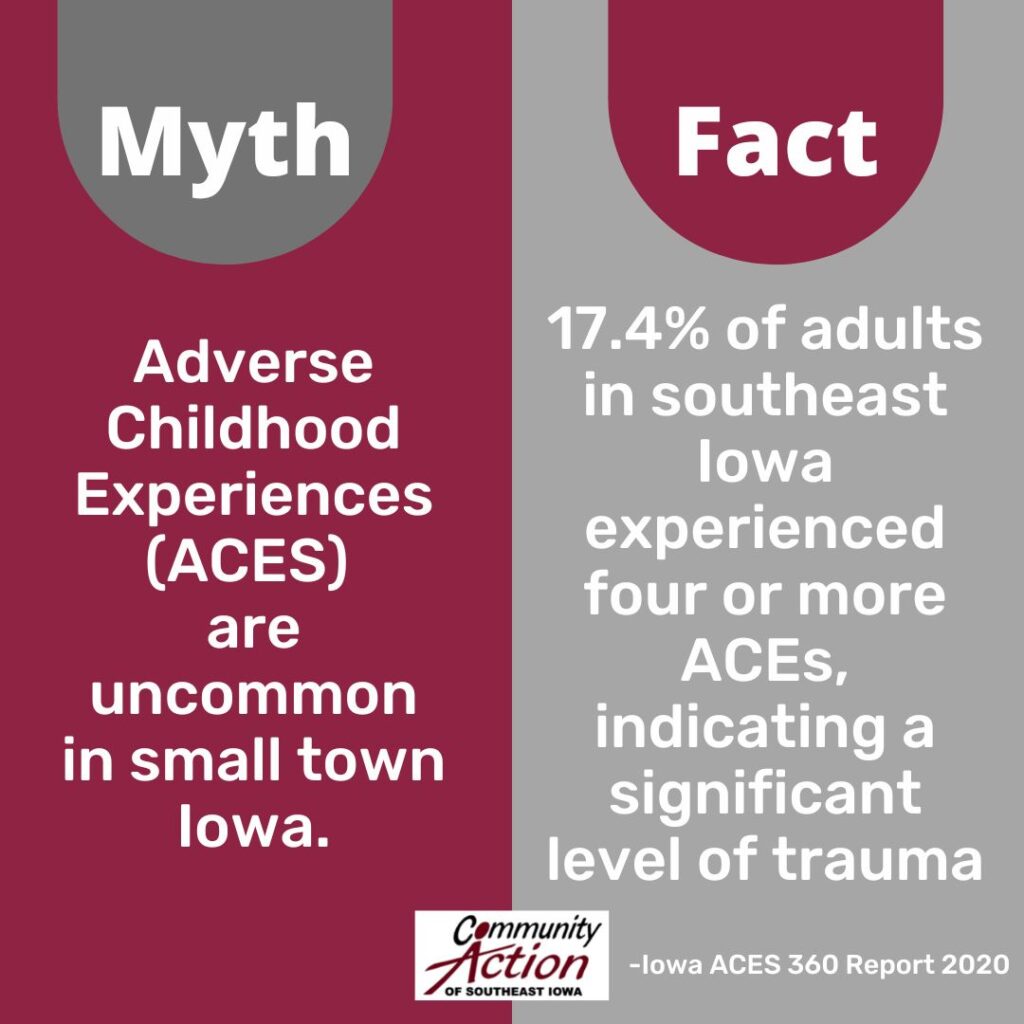
Iowa ACES 360 Report
https://www.iowaaces360.org/…/10925571/acesreport2020.pdf
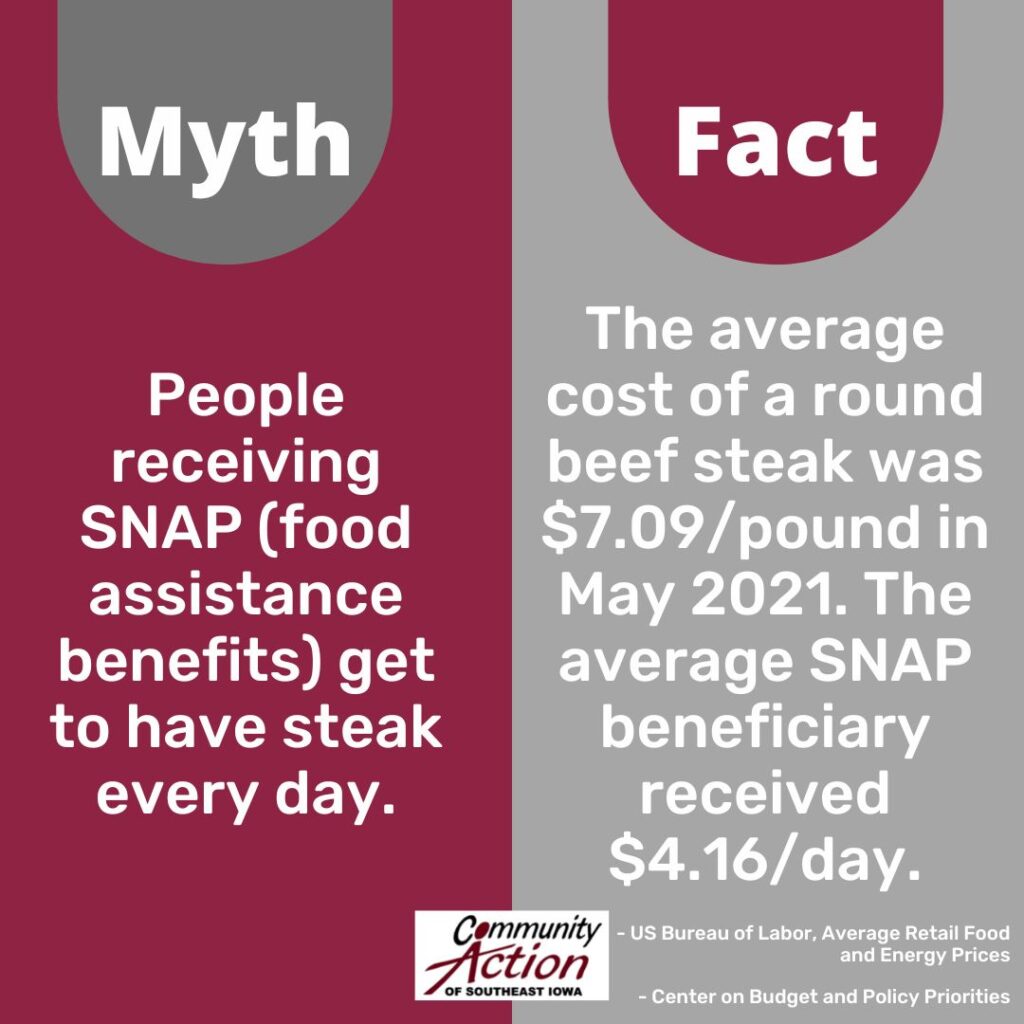
Of those who are able to work and are receiving SNAP, most of them do work. “Pre-pandemic data show that nearly 90 percent of participants are in households with a child under age 18, an adult age 60 or older, or an individual who is disabled.”
https://www.cbpp.org/research/food-assistance/the-supplemental-nutrition-assistance-program-snap
Average Retail Food and Energy Prices, U.S. and Midwest Region https://www.bls.gov/regions/mid-atlantic/data/averageretailfoodandenergyprices_usandmidwest_table.htm
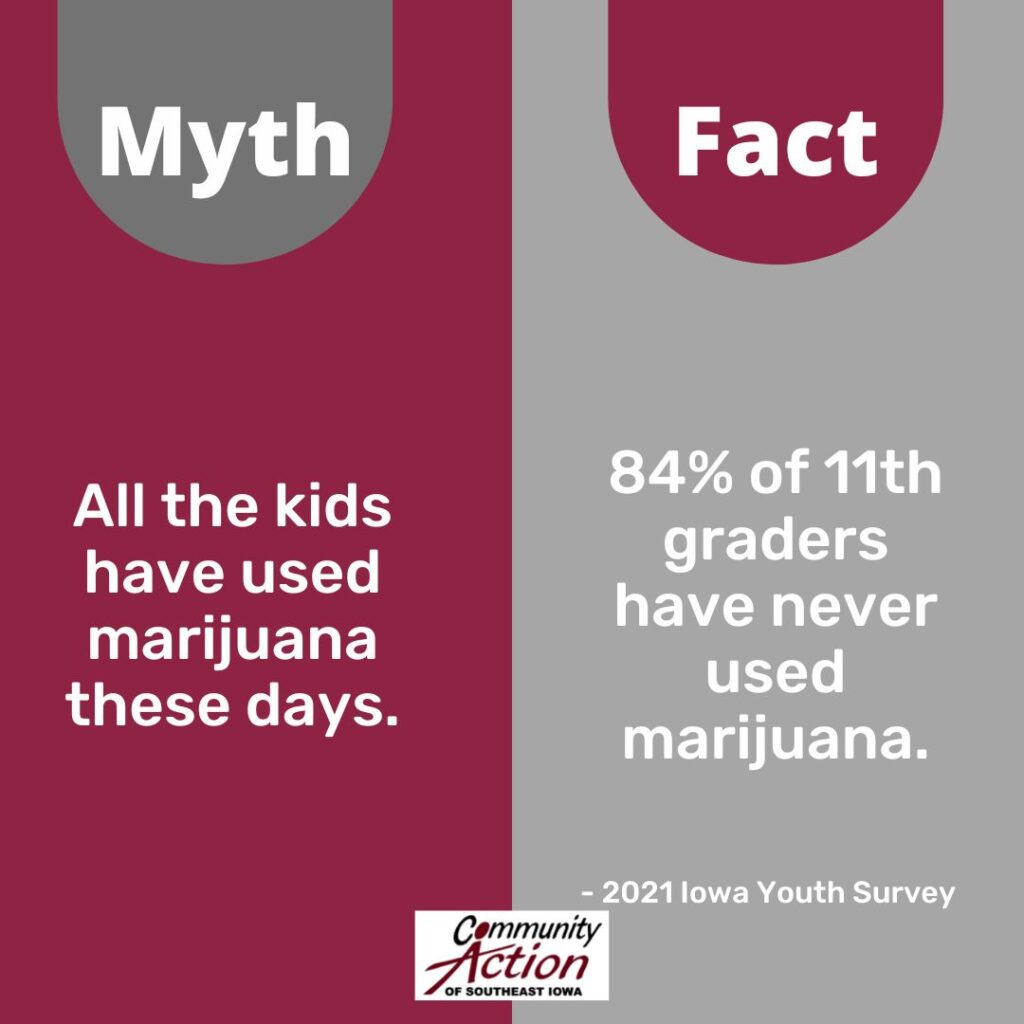
“THC in marijuana can affect decision making, concentration, and memory for days after use.” https://teens.drugabuse.gov/drug-facts/marijuana#topic-2
2021 Iowa Youth Survey: https://iowayouthsurvey.idph.iowa.gov/Portals/20/IYS_Reports/1/ae0f13b7-8afd-49a8-9d87-84d2e0b846ab.pdf
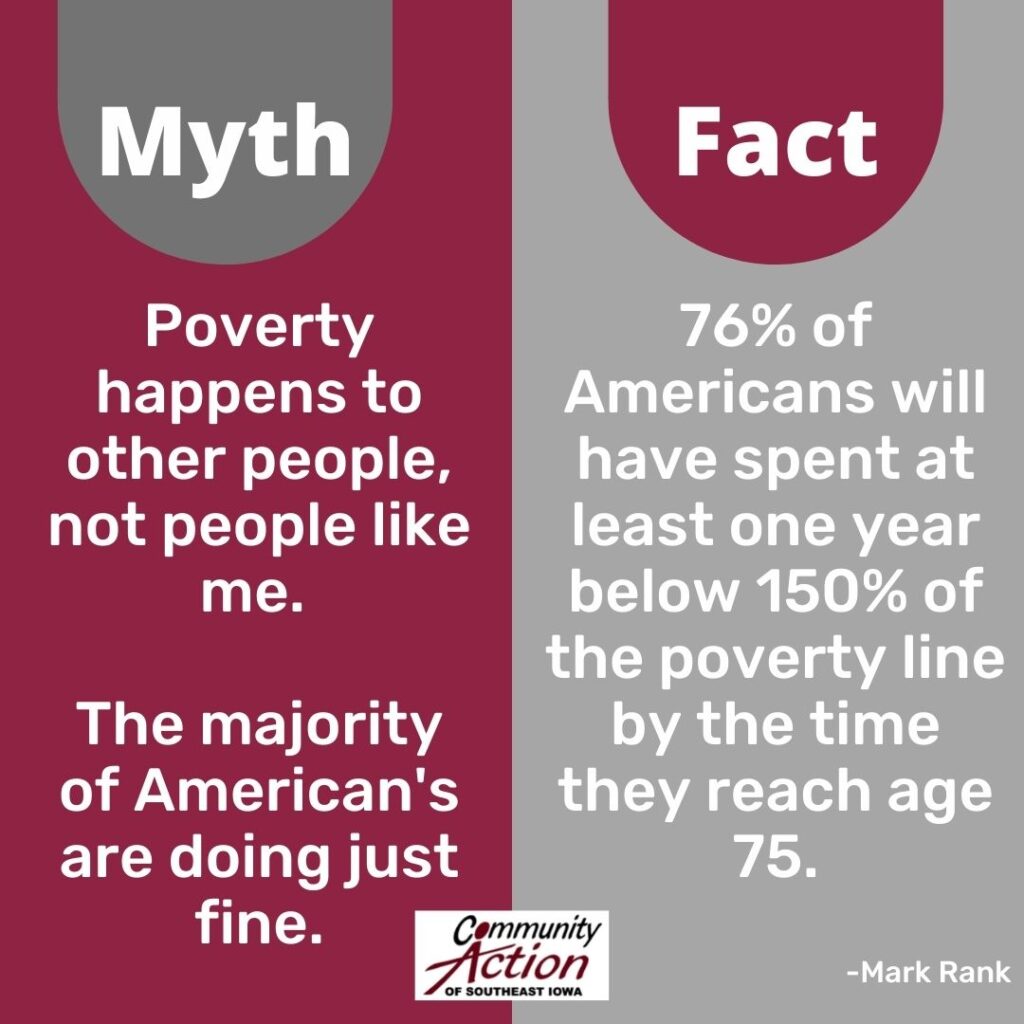
Read more around this topic by Mark Rank here: https://confrontingpoverty.org/…/most-americans-will…/
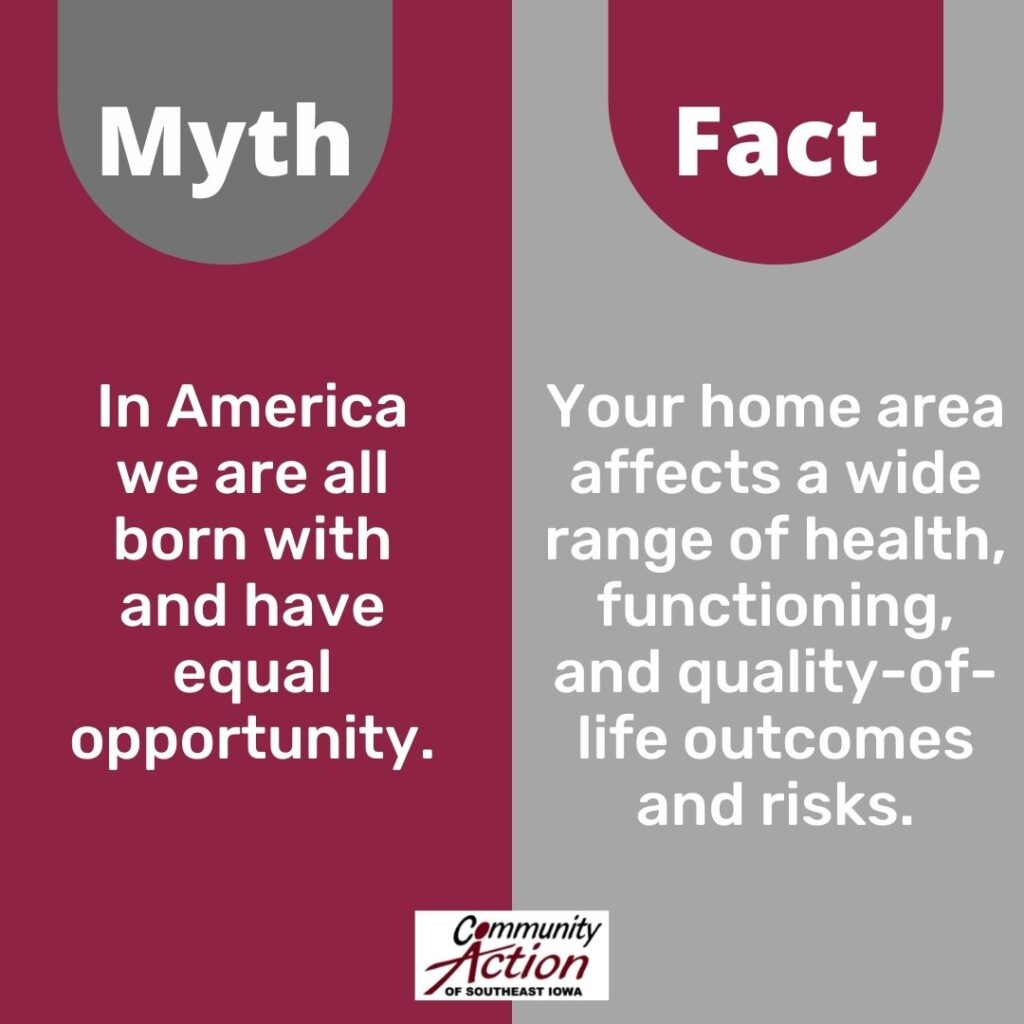
Social determinants of health (SDOH) are conditions in the places where people live, learn, work, and play that affect a wide range of health risks and outcomes. Many start out disadvantaged.
https://www.cdc.gov/socialdeterminants/about.html
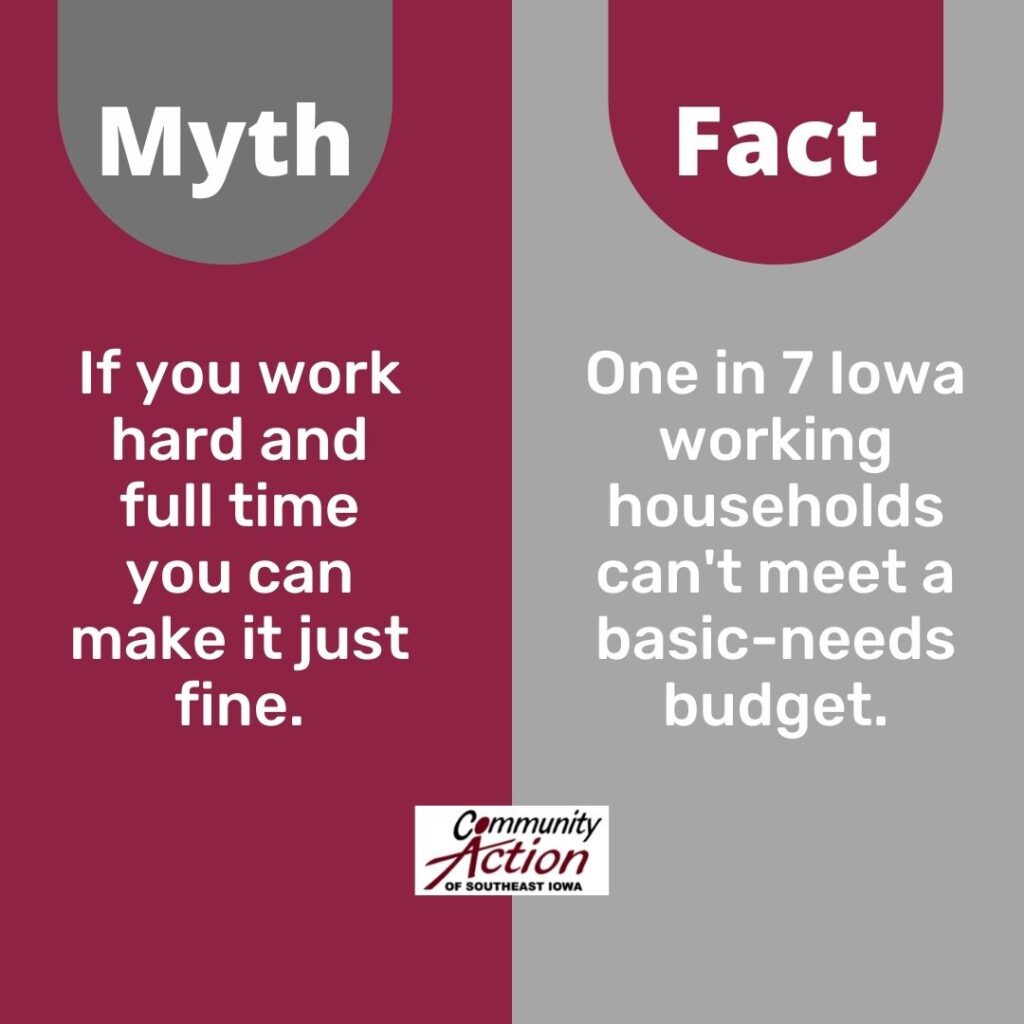
The Cost of Living in Iowa 2022 is a report and interactive map for all 99 counties in Iowa. They have simple descriptions all the way up to complicated data and policy recommendations.
https://www.commongoodiowa.org/data/cost-of-living-in-iowa
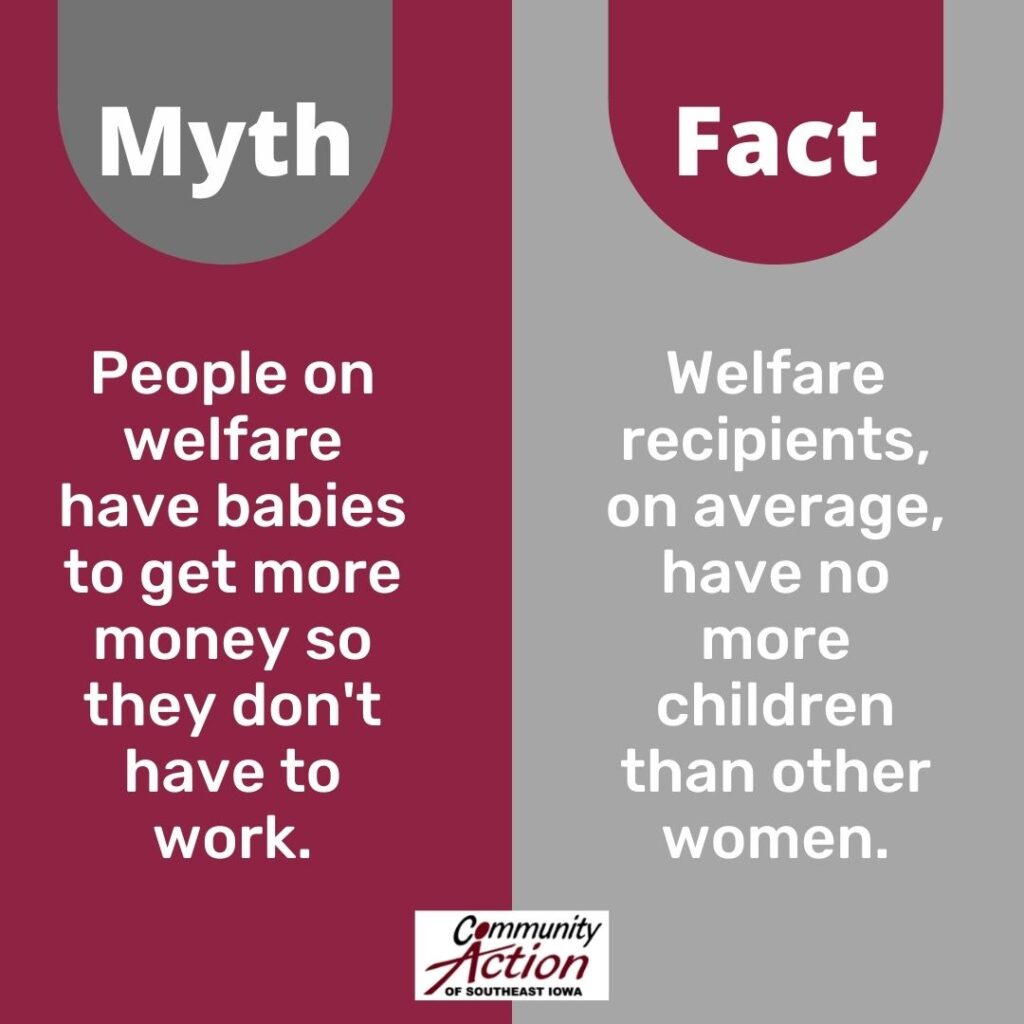
This myth popularized in the 1970’s and 80’s still hangs around today. There was a high profile case that led to a propagation of this myth, the Welfare Queen.
“…the welfare queen stood in for the idea that black people were too lazy to work, instead relying on public benefits to get by, paid for by the rest of us upstanding citizens. She was promiscuous, having as many children as possible in order to beef up her benefit take. It was always a myth—white people have always made up the majority of those receiving government checks, and if anything, benefits are too miserly, not too lavish. But it was a potent stereotype, which helped fuel a crackdown on the poor and a huge reduction in their benefits, and it remains powerful today.”
Read more about the story and real person Linda Taylor here:
https://newrepublic.com/article/154404/myth-welfare-queen
